Introduction
We're now ready to fetch our data of DW-NOMINATE scores and display them in a SwiftUI view to re-create the chart below:
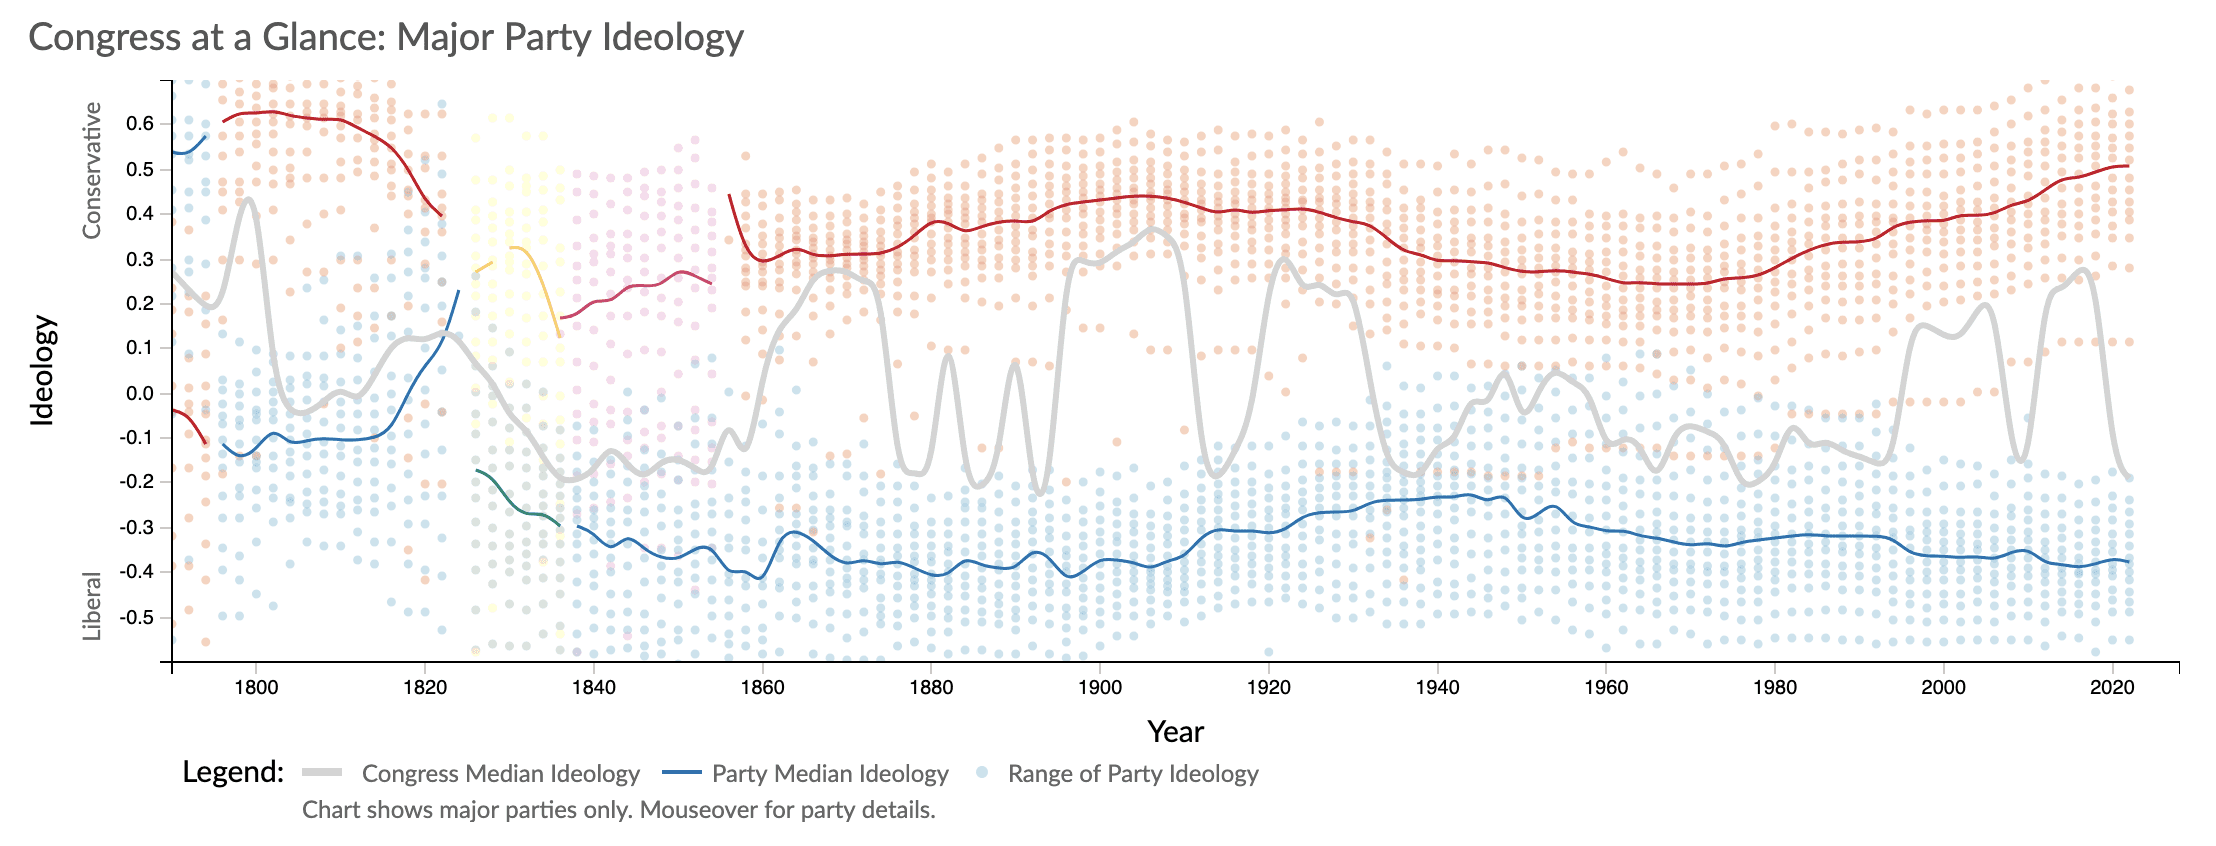
This chart is made by plotting the DW-NOMINATE score of the median Democrat and Republican to produce the blue and red lines as well as the median member of Congress to produce the gray line, which swings back and forth as the balance of power shifts each cycle.
In our own chart, since we'll be working with a relatively small screen, we're going to ignore the distribution of red and blue dots.
While Voteview does have a data file with the mean and median scores for each Congress, they are unfortunately broken down by chamber with no way to calculate the median for a party across both the House and Senate. If we wanted to display a Picker and have the user select the chamber they want to see, this would work perfectly, but in the interest of creating the exact chart above, we'll have to download the DW-NOMINATE score of every single member, resulting in a longer-running function to fetch and decode the data and more work by us to calculate the median ourselves.
Creating the data model
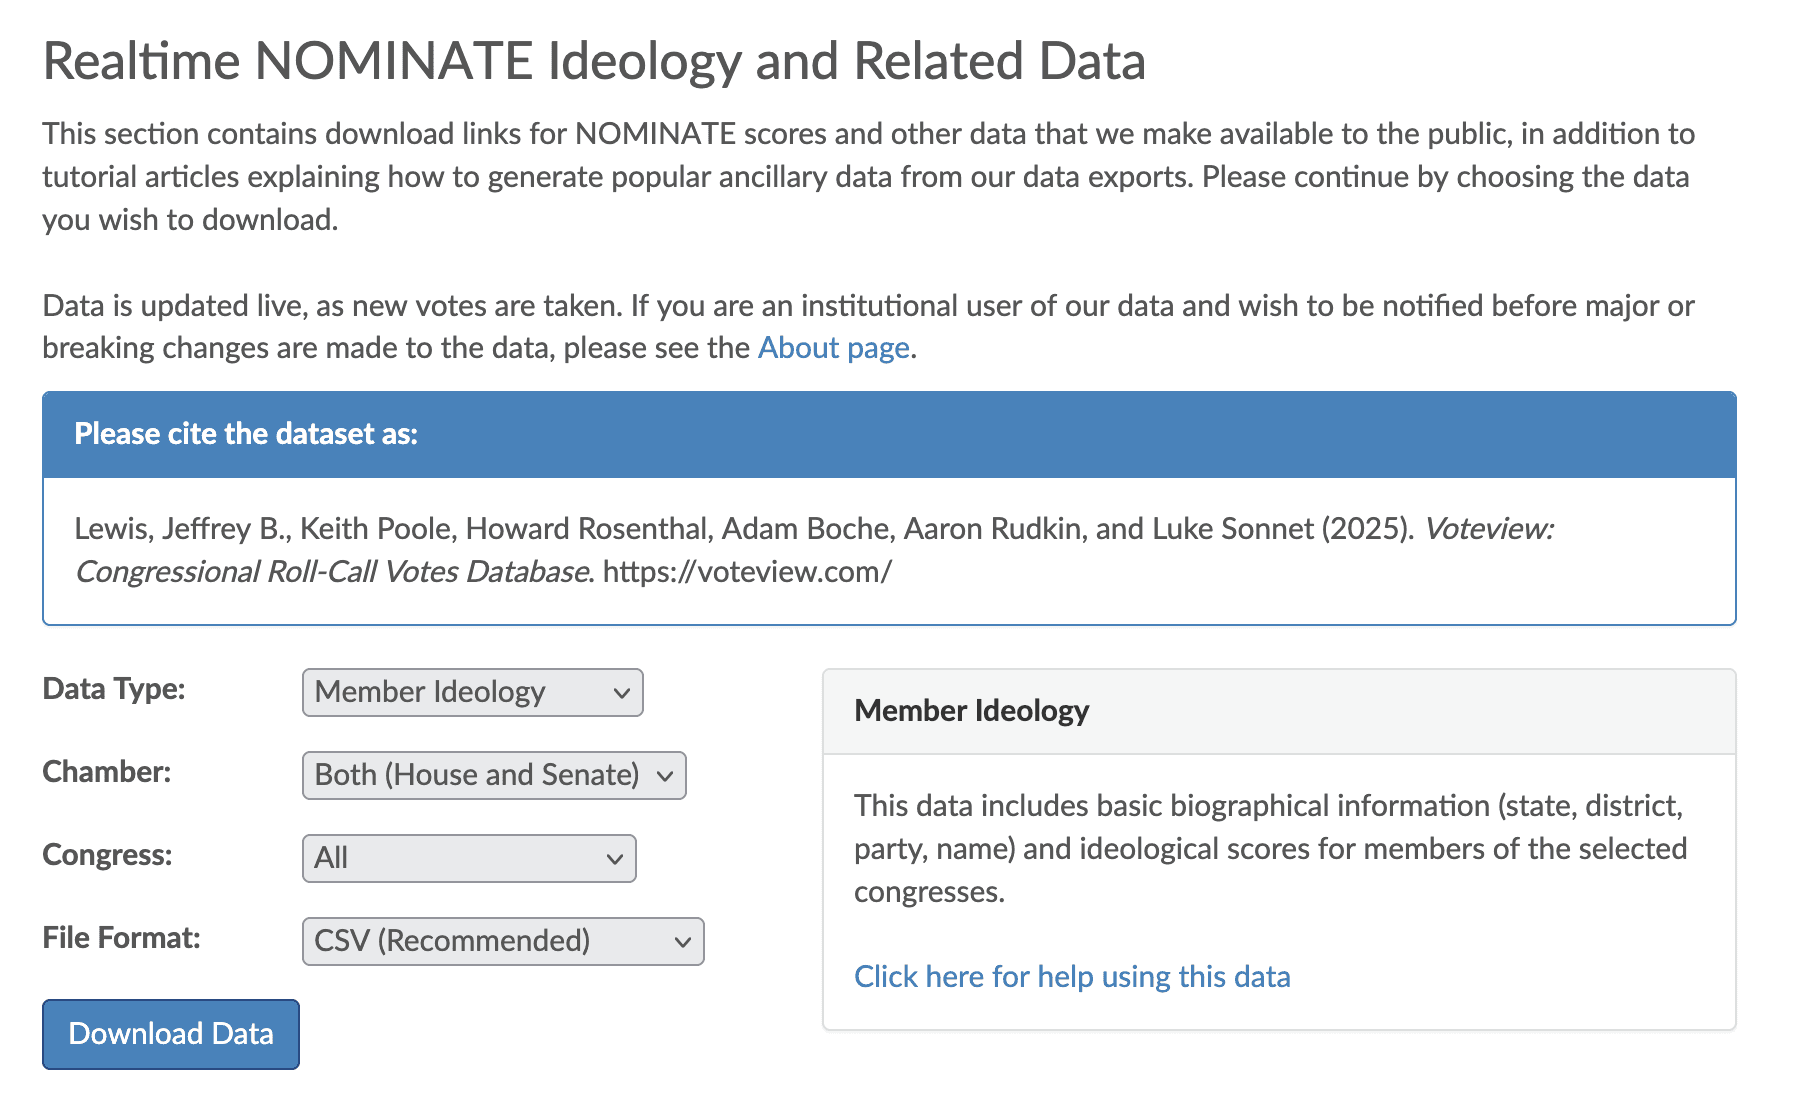
Let's download a local file of our data to see how it's structured by going to https://voteview.com/data and using the below options and clicking "Download Data."
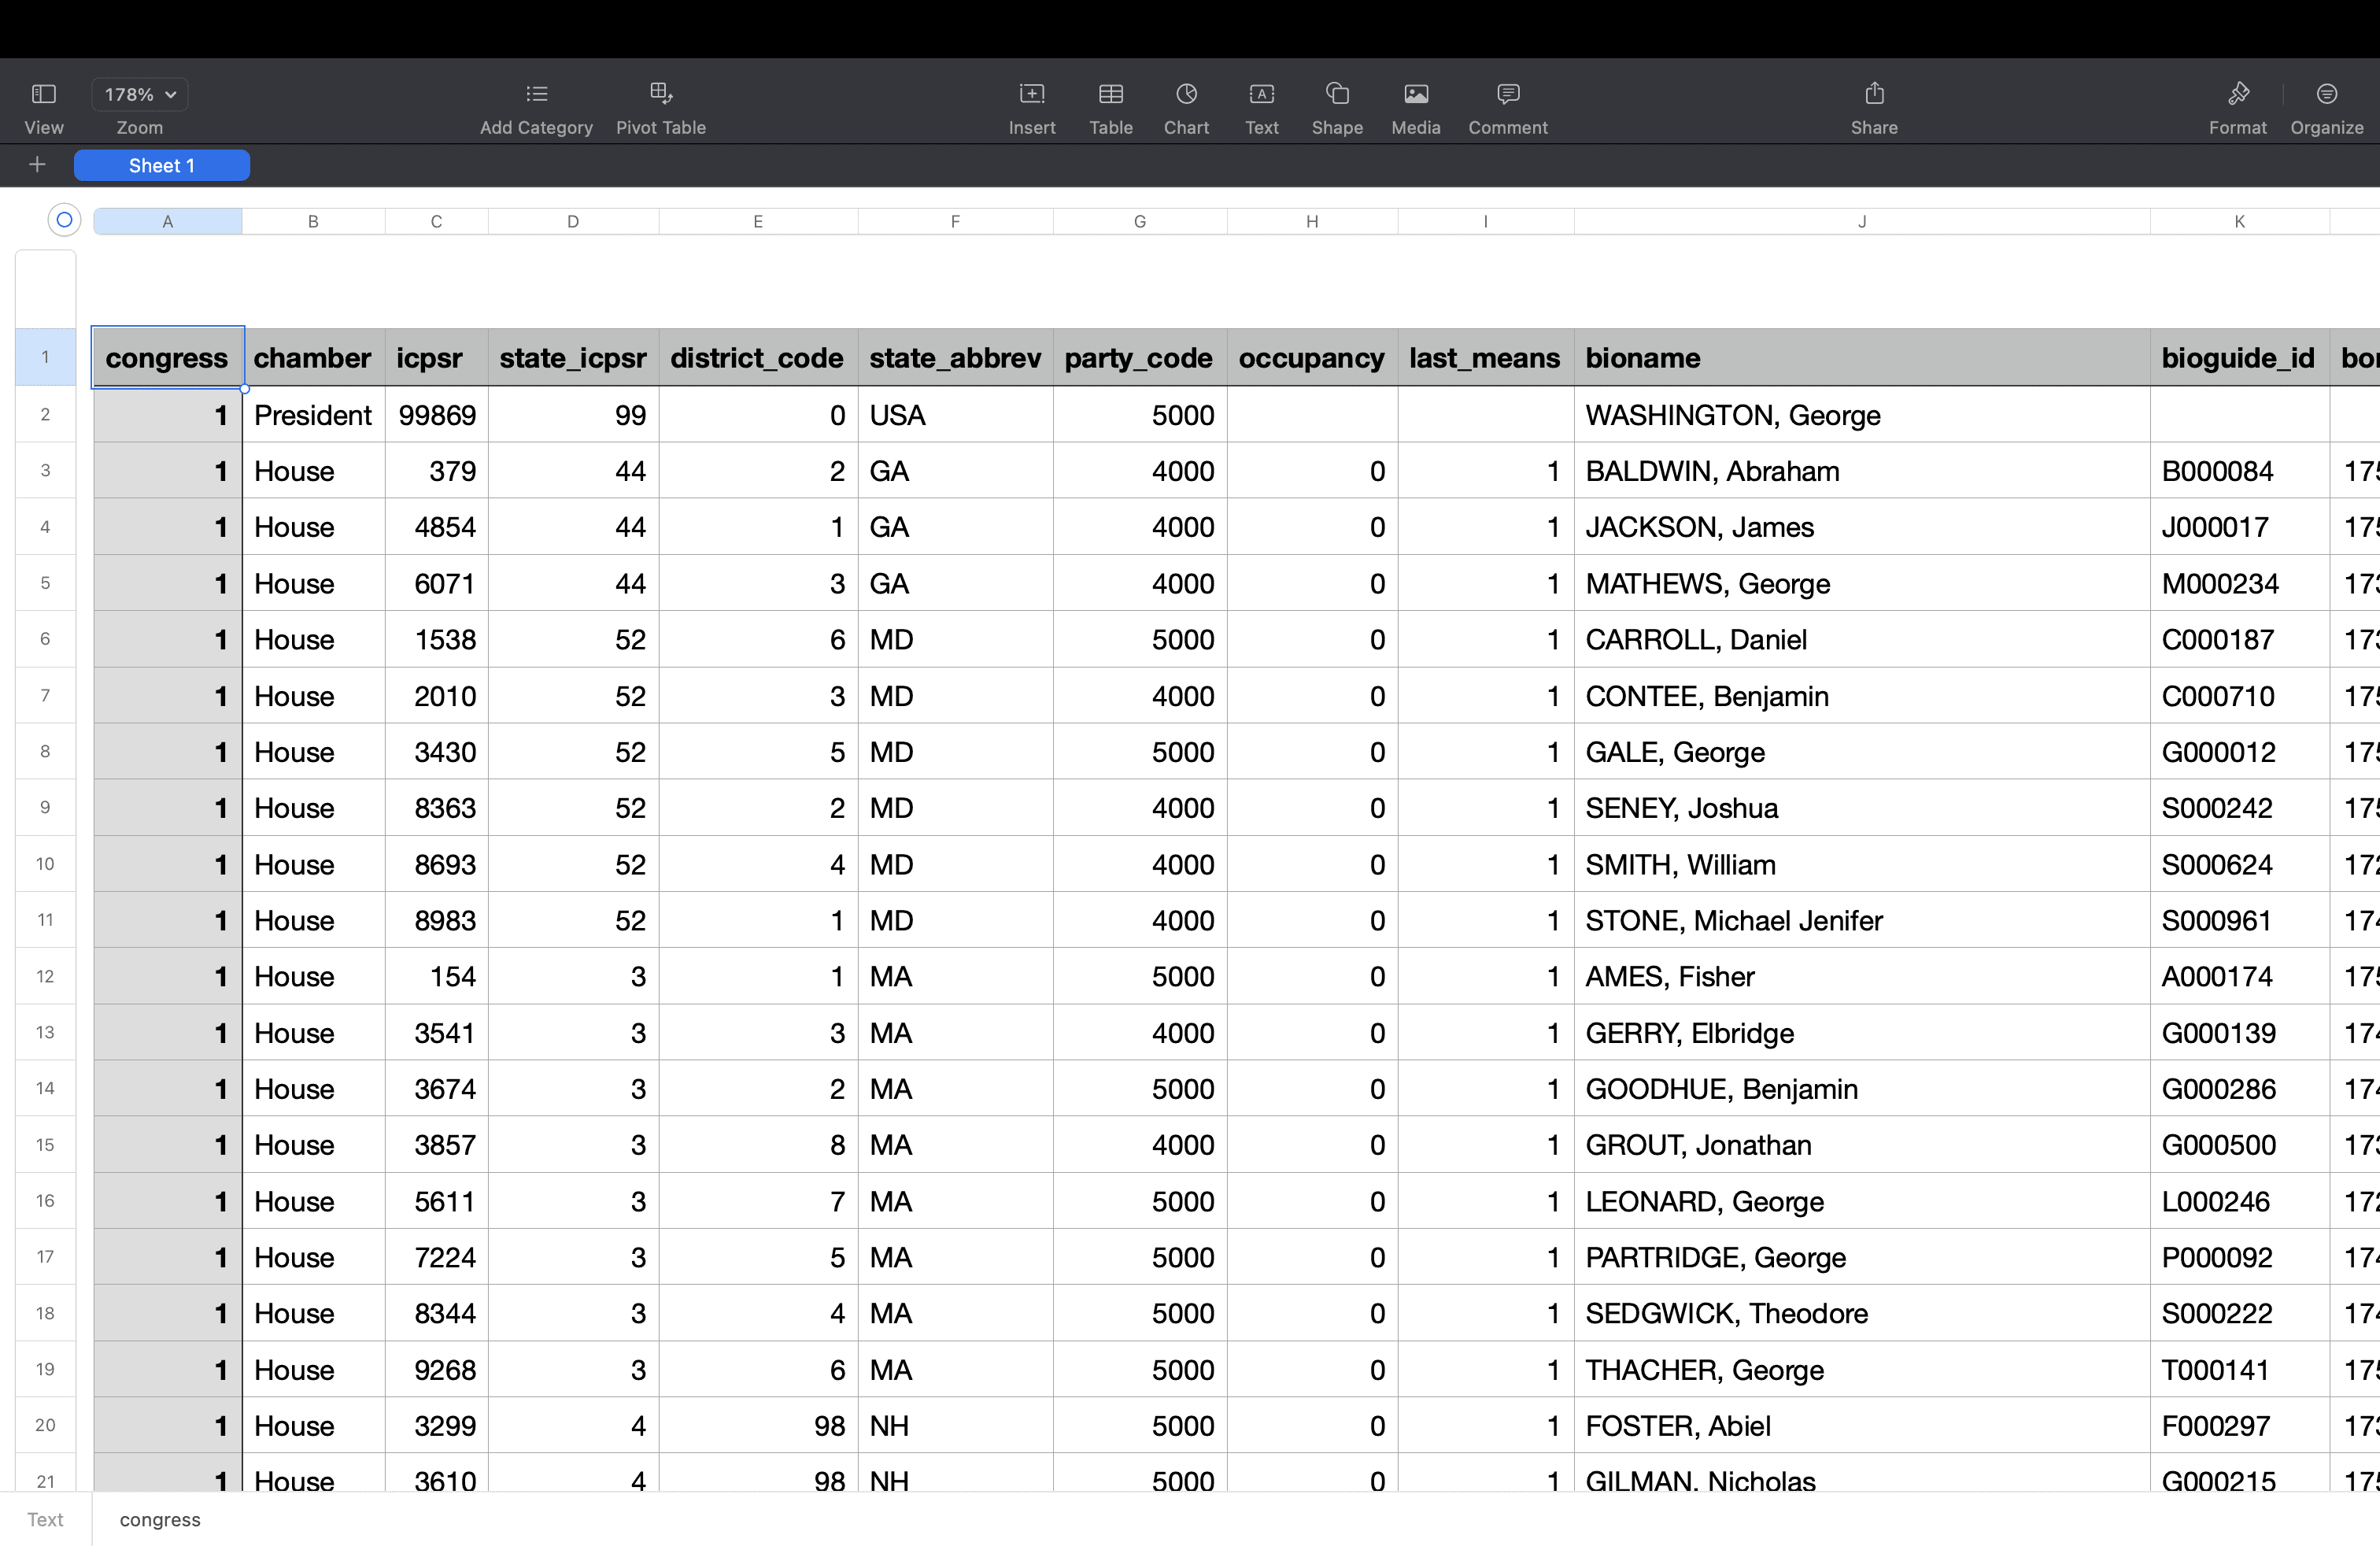
The resulting file has several columns, but the only ones we will need to decode are:
icpsr, which is an ID that identifies the member in question
congress, an integer from 1 through 119 that identifies the session of Congress
chamber, which can be House, Senate, or President
party_code, an integer corresponding to a political party (e.g., 100 is for the Democratic Party and 200 is for the Republican Party)
bioname, the name of the member of Congress
and nominate_dim1, which is the member's DW-NOMINATE score for the first dimension (we'll ignore the second dimension in our chart)
Our data model, which conforms to Identifiable and Codable, is below, with the DW-NOMINATE score being an optional Double, since some rows, like presidents, don't have one.
struct DWNominateScore: Identifiable, Codable {
    let icpsr: Int
    let congress: Int
    let chamber: String
    let partyCode: Int
    let bioname: String
    let nominateDim1: Double?

    var id: Int { icpsr }

    enum CodingKeys: String, CodingKey {
        case icpsr
        case congress
        case chamber
        case partyCode = "party_code"
        case bioname
        case nominateDim1 = "nominate_dim1"
    }
}
Displaying our scores in a list
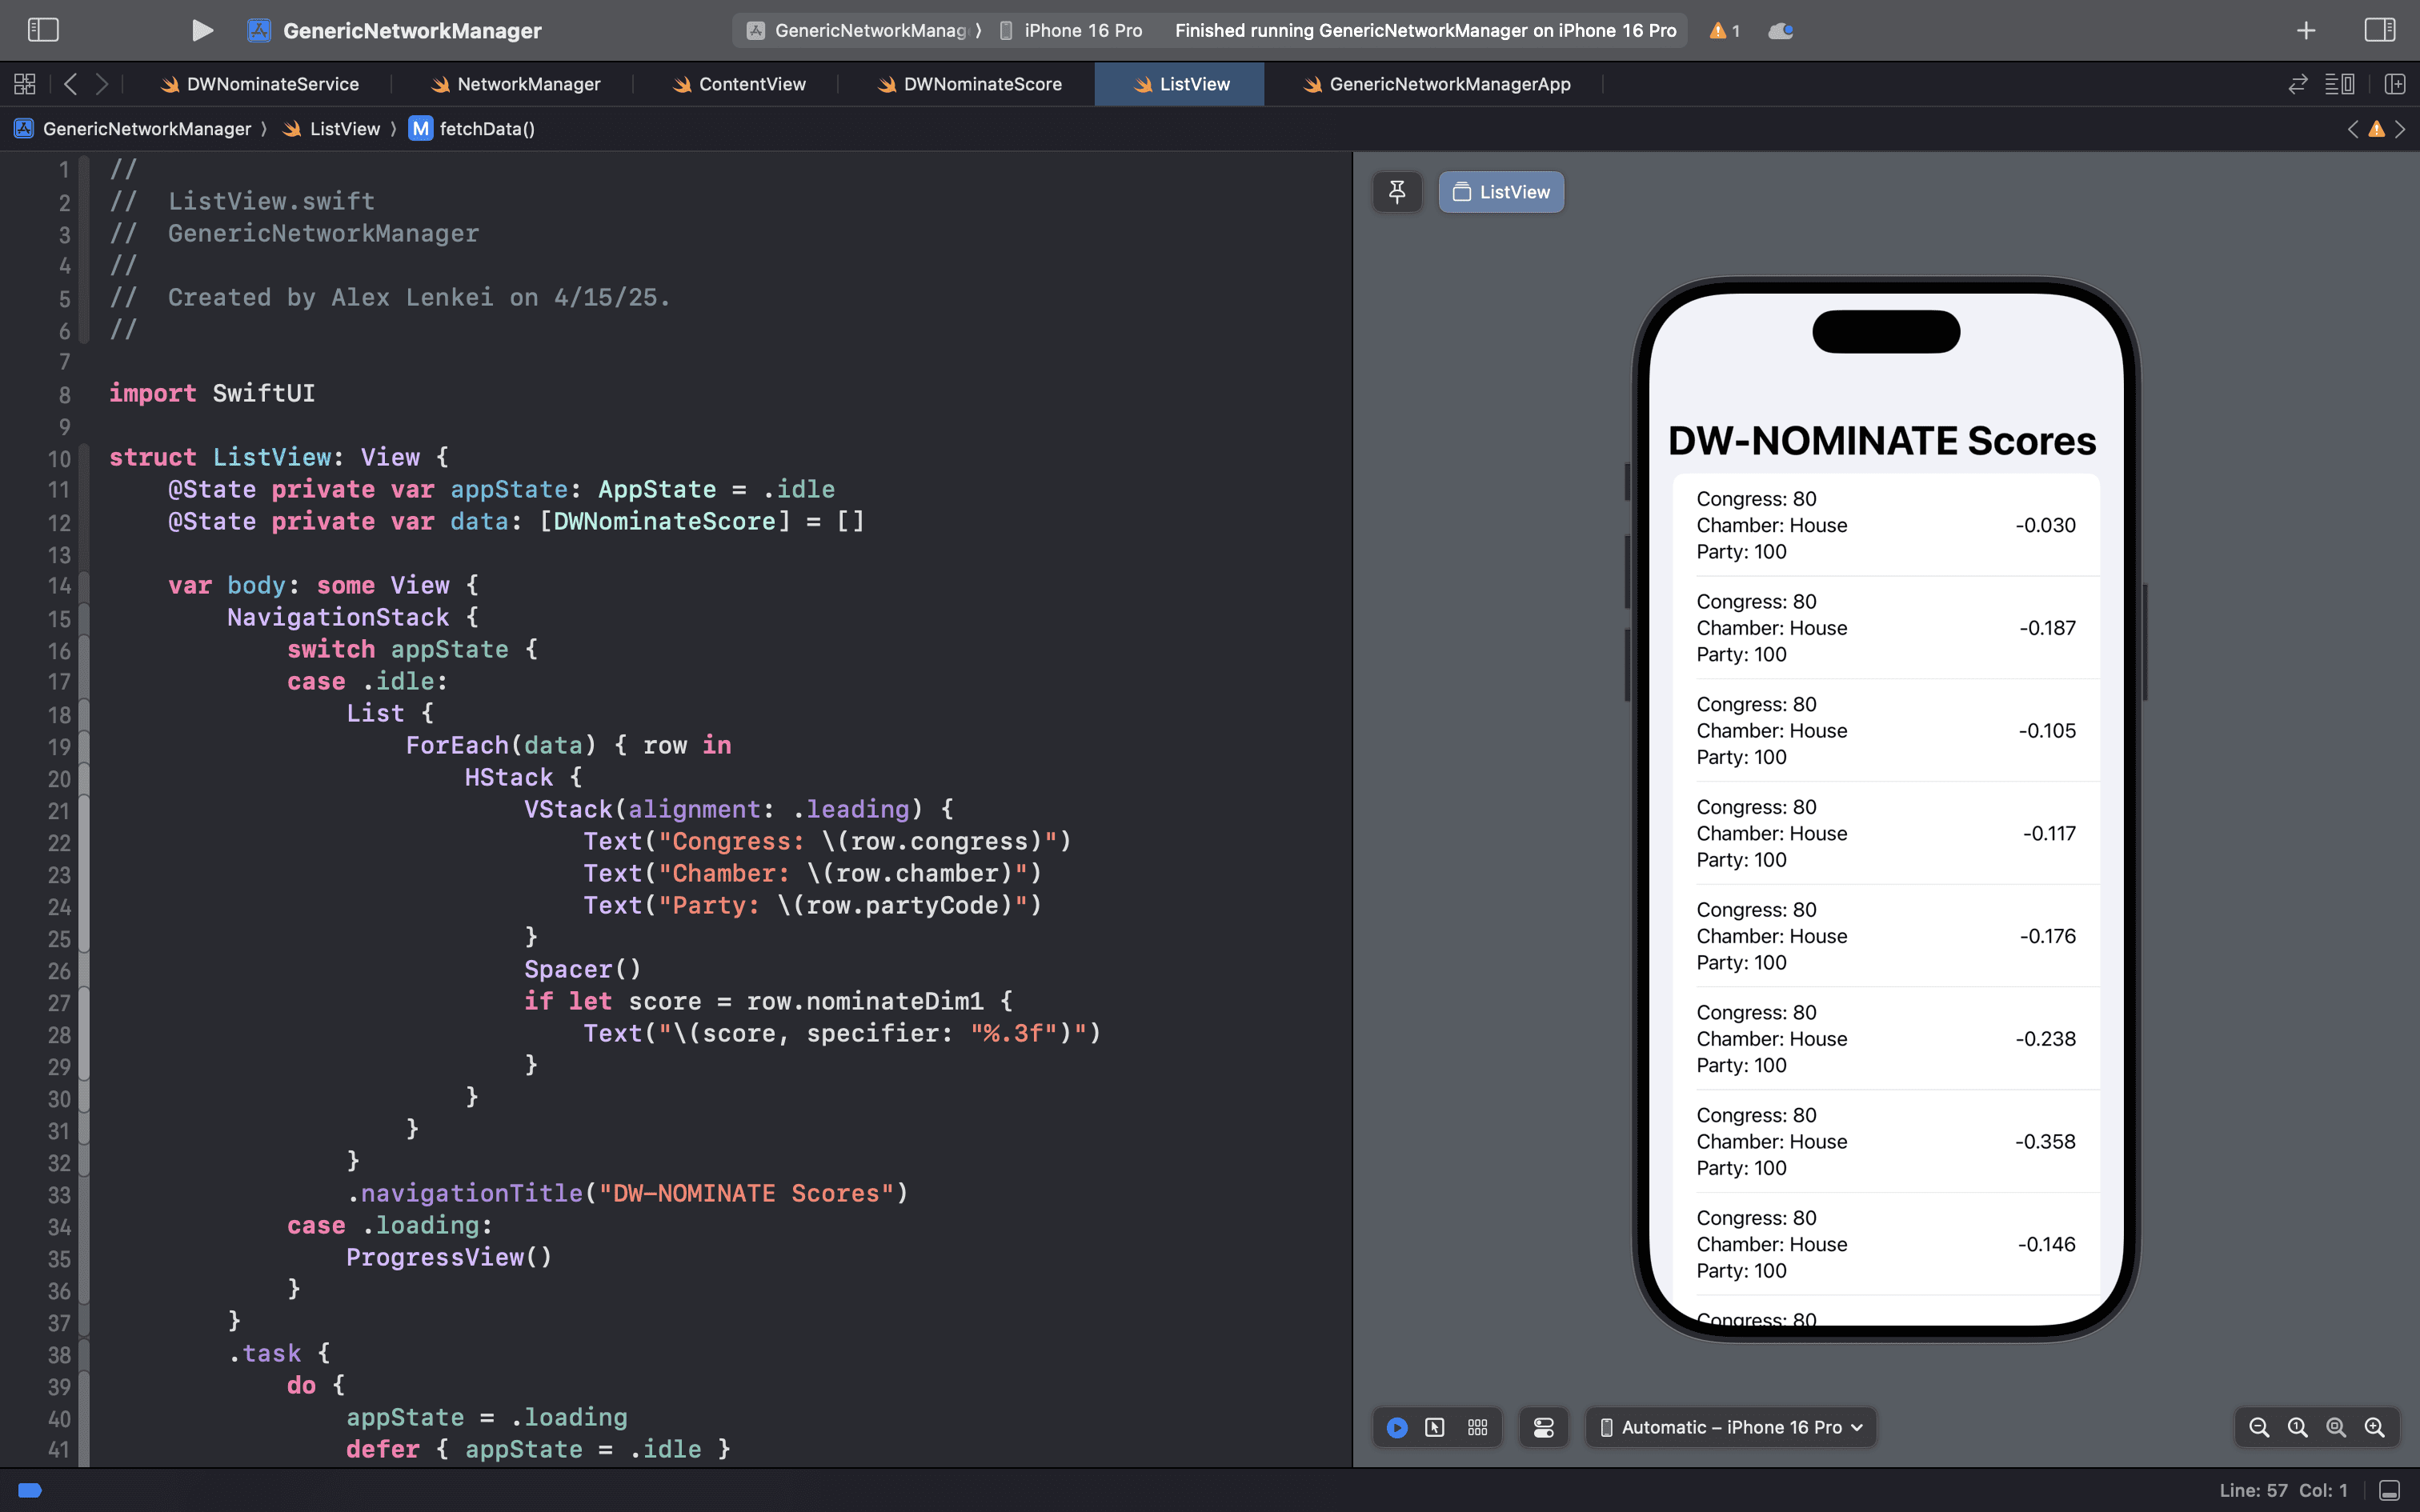
To make sure we've correctly fetched and decoded our data, let's set up a quick List view:
struct ListView: View {
	@State private var appState: AppState = .idle
	@State private var data: [DWNominateScore] = []

	var body: some View {
		NavigationStack {
			switch appState {
			case .idle:
				List {
					ForEach(data) { row in
						HStack {
							VStack(alignment: .leading) {
								Text("Congress: \(row.congress)")
								Text("Chamber: \(row.chamber)")
								Text("Party: \(row.partyCode)")
							}
							Spacer()
							if let score = row.nominateDim1 {
								Text("\(score, specifier: "%.3f")")
							}
						}
					}
				}
				.navigationTitle("DW-NOMINATE Scores")
			case .loading:
				ProgressView()
			}
		}
		.task {
			do {
				appState = .loading
				defer { appState = .idle }

				data = try await fetchData()

			} catch {
				print("Error: \(error)")
			}
		}
	}

	nonisolated private func fetchData() async throws -> [DWNominateScore] {
		let service = DWNominateService()
		let result = try await service.fetchDWNominateScores(dataType: .memberIdeology, chamber: .houseAndSenate, congress: .all, fileType: .csv) ?? []
		return result.filter { $0.congress >= 80 && ($0.partyCode == 100 || $0.partyCode == 200) && $0.chamber != "President" }
	}
}
(For some reason, the "not equal to" operator in Swift (!=) renders above as ≠, but it will copy and paste correctly.)
That view has several parts:
we have two @State properties, one that holds our decoded data and one that tracks whether the data is being loaded or not
we switch on the appState and show either a ProgressView() or a List.
the List has rows with the congress number, chamber, party code, and DW-NOMINATE score in each row. The score needs to be unwrapped and has some formatting to only show the first 3 digits after the decimal
the .task modifier creates an asynchronous context for our network call. Because that call can throw an error, we call it with the try await keywords and wrap it in a do-catch block.
we also set the appState equal to .loading at the beginning of this block and use the defer keyword to ensure that the last code executed sets the appState back to .idle.
to keep our body property small and manageable, I've refactored the network call into a function called fetchData() where we
initialize the service class DWNominateService we created in part 2
make the network call and assign the decoded response to a constant called result
and filter result so it only contains the 80th Congress and newer, the Republican and Democratic Parties, and the House and Senate chambers
The return value of this function is then assigned to our @State property, data. Assuming you've done everything correctly, here's the result:
Although it does take some time for the CSV data to be parsed, the decoded response could then be persisted, for example in SwiftData, making future loading times for this list much faster.
A brief detour into Swift Concurrency
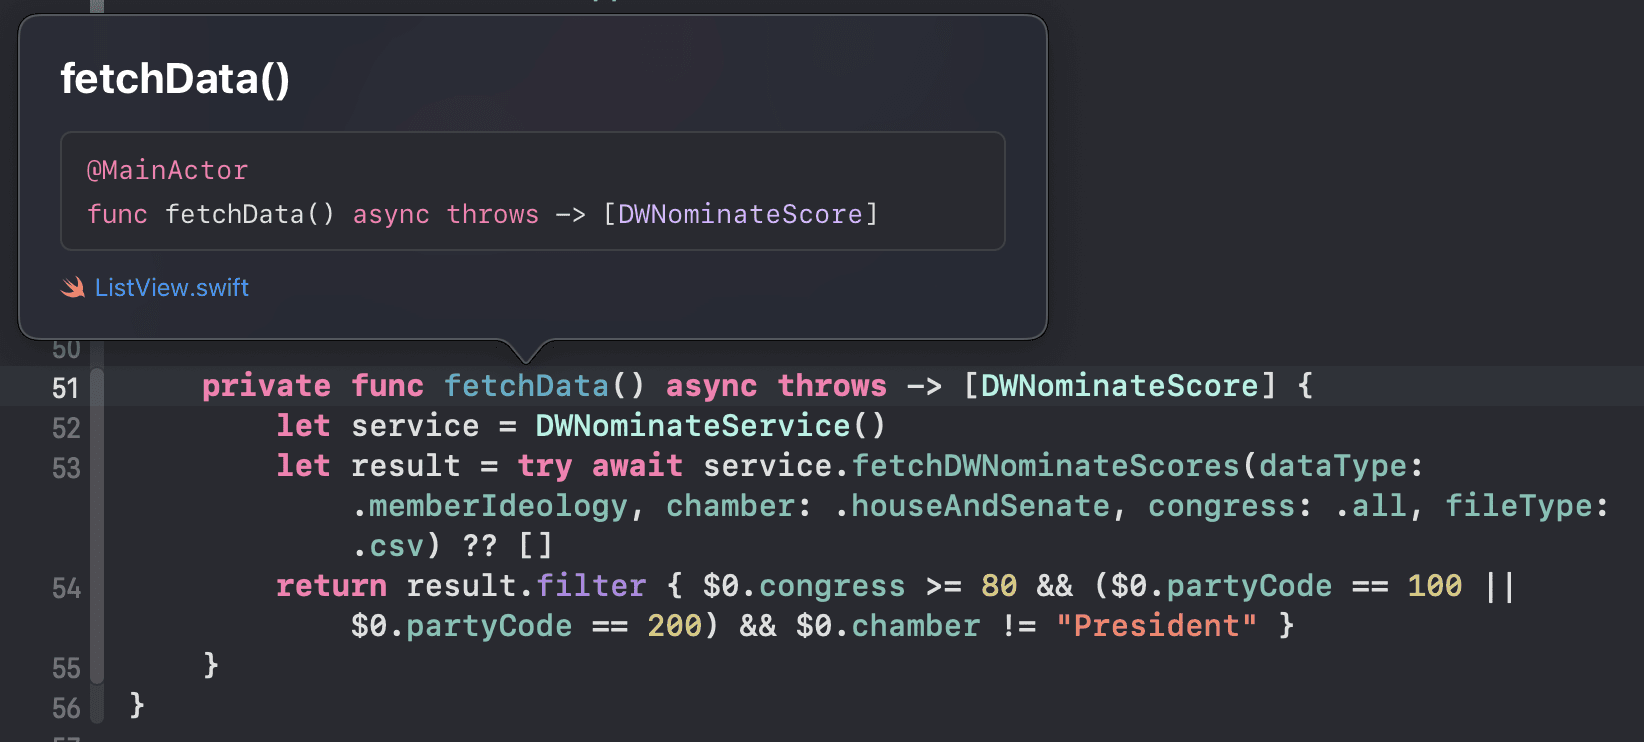
Let's talk for a minute about that nonisolated keyword in our fetchData() declaration. I'm very much still learning Swift Concurrency so I'll lean heavily on this excellent blog post from Matt Massicotte, "Concurrency Step-by-Step: A Network Request," to explain what it's doing.
Let's remove nonisolated and ask, "Where is this function running? On the main thread or a background thread?" Or, more accurately, is it on the MainActor or not? Because the function is asynchronous, you might think it's running in the background, but the method's containing type, ListView, conforms to View, which is on the MainActor, and MainActor propagates through the structure of a type due to something called "actor inference." This can be confirmed if we option-click on the method declaration in Xcode. We see that it's annotated with @MainActor:
So we can add some comments to our code to reflect our understanding of where things are running:
private func fetchData() async throws -> [DWNominateScore] {
let service = DWNominateService()
let result = try await service.fetchDWNominateScores(dataType: .memberIdeology, chamber: .houseAndSenate, congress: .all, fileType: .csv) ?? []
return result.filter { $0.congress >= 80 && ($0.partyCode == 100 || $0.partyCode == 200) && $0.chamber != "President" }
}
Although filtering usually isn't too computationally expensive (it has O(n) complexity), the result array is quite large, and there's no reason to be filtering it on the MainActor because it has nothing to do with our UI. So, let's fix that!
Here's where nonisolated comes in and we can add it back to our method declaration. As Matt tells us:
What nonisolated does is stop any actor inference and ensure that there will not be any isolation for a function. No isolation means no MainActor and that means background thread.
...
It is extremely common for people to see the word nonisolated and think “unsafe.” But, the nonisolated keyword just controls how actor inference works. The compiler will not allow you to introduce any unsafety. And if you don’t believe that for some reason, try it! Like we just saw, you cannot read or write values that need isolation from a non-isolated function. There are even strict rules about what you can get into and out of a non-isolated function. The language as a whole works to implement the data race safety feature of Swift.
Creating a SwiftUI chart
Unfortunately, our data isn't quite chart-ready yet since we need to transform our array of DWNominateScore into something else that we'll call ChartData.
struct ChartData: Identifiable, Hashable {
	let id: UUID
	let congress: Int
	let median: Double
	let party: String
}
The function to transform the data is a little convoluted, and if you know a more efficient way, please let me know!
nonisolated private func getChartData(data: [DWNominateScore]) async -> [ChartData] {
	var array = [ChartData]()

	let demScores = data.filter { $0.partyCode == 100 }
	let repScores = data.filter { $0.partyCode == 200 }
	let congresses = Array(Set(data.map { $0.congress }))

	for congress in congresses {
		var demScoresDouble = demScores.filter { $0.congress == congress }.map { $0.nominateDim1 ?? 0 }
		let demMedian = demScoresDouble.findMedian()

		var repScoresDouble = repScores.filter { $0.congress == congress }.map { $0.nominateDim1 ?? 0 }
		let repMedian = repScoresDouble.findMedian()

		var congressScoresDouble = data.filter { $0.congress == congress }.map { $0.nominateDim1 ?? 0 }
		let congressMedian = congressScoresDouble.findMedian()

		let demResult = ChartData(id: UUID(), congress: congress, median: demMedian, party: "Democrats")
		let repResult = ChartData(id: UUID(), congress: congress, median: repMedian, party: "Republicans")
		let congressResult = ChartData(id: UUID(), congress: congress, median: congressMedian, party: "Congress")

		array.append(contentsOf: [demResult, repResult, congressResult])
	}
	return array.sorted { $0.congress < $1.congress }
}
Here's what that function's doing:
It isolates the Democratic scores from the Republican scores and creates an array of the Congress integers (so 80 through 119).
A for-in loop iterates through each integer
For each iteration (that is, for each Congress), we need to find the Democratic median, the Republican median, and the Congressional median (using a findMedian() function defined below)
Then, we need to create an instance of ChartData with the UUID, the Congress integer, the median we calculated, and a string identifying the party. We then append this to an array variable.
Upon exiting the loop, we return the array, remembering to sort it by congress integer
This function is also again nonisolated because I put it just below the fetchData() function and don't want it to run on the MainActor.
Here's the extension to find the median of an array of doubles:
extension Array where Element == Double {
	mutating func findMedian() -> Double {
		self.sort()
		let size = self.count

		if (size % 2 != 0) {
			return self[size/2]
		} else {
			return (self[(size - 1) / 2] + self[size / 2]) / 2
		}
	}
}
Similar to the ListView we created above, let's start with a ContentView that will hold our functions to fetch our data and transform it into ChartData as well as a progress view for when we're loading data and a ChartView once it's all loaded. And because we're good iOS developers who care about smooth animations, let's add a transition and wrap appState = .idle in a withAnimation block.
Lastly, our @State property is no longer of type DWNominateScore but rather the ready-to-use ChartData with the getChartData(data:) function running in our .task modifier.
struct ContentView: View {
	@State private var appState: AppState = .idle
	@State private var chartData: [ChartData] = []

    var body: some View {
		NavigationStack {
			switch appState {
			case .idle:
				ChartView(chartData: chartData)
					.transition(.opacity)
			case .loading:
				ProgressView()
			}
		}
		.task {
			do {
				appState = .loading
				defer {
					withAnimation { appState = .idle }
				}

				let data = try await fetchData()

				chartData = await getChartData(data: data)
			} catch {
				print("Error: \(error)")
			}
		}
    }

	nonisolated private func fetchData() async throws -> [DWNominateScore] {
		let service = DWNominateService()
		let result = try await service.fetchDWNominateScores(dataType: .memberIdeology, chamber: .houseAndSenate, congress: .all, fileType: .csv) ?? []
		return result.filter { $0.congress >= 80 && ($0.partyCode == 100 || $0.partyCode == 200) && $0.chamber != "President" }
	}

	nonisolated private func getChartData(data: [DWNominateScore]) async -> [ChartData] {
		var array = [ChartData]()

		let demScores = data.filter { $0.partyCode == 100 }
		let repScores = data.filter { $0.partyCode == 200 }
		let congresses = Array(Set(data.map { $0.congress }))

		for congress in congresses {
			var demScoresDouble = demScores.filter { $0.congress == congress }.map { $0.nominateDim1 ?? 0 }
			let demMedian = demScoresDouble.findMedian()

			var repScoresDouble = repScores.filter { $0.congress == congress }.map { $0.nominateDim1 ?? 0 }
			let repMedian = repScoresDouble.findMedian()

			var congressScoresDouble = data.filter { $0.congress == congress }.map { $0.nominateDim1 ?? 0 }
			let congressMedian = congressScoresDouble.findMedian()

			let demResult = ChartData(id: UUID(), congress: congress, median: demMedian, party: "Democrats")
			let repResult = ChartData(id: UUID(), congress: congress, median: repMedian, party: "Republicans")
			let congressResult = ChartData(id: UUID(), congress: congress, median: congressMedian, party: "Congress")

			array.append(contentsOf: [demResult, repResult, congressResult])

		}
		return array.sorted { $0.congress < $1.congress }
	}
}
Moving on to ChartView, let's start by iterating through the data with a LineMark. The x axis is the median score, the y axis is the Congress integer, and the series is the value we want to use to separate the data into different categories, in this case, the party (remember, we defined our parties as the strings "Democrats," "Republicans," and "Congress").
struct ChartView: View {
	let chartData: [ChartData]

	var body: some View {
		Chart {
			ForEach(chartData, id: \.self) { element in
				LineMark(
					x: .value("DW-NOMINATE Score", element.median),
					y: .value("Congress", element.congress),
					series: .value("Party", element.party)
				)
				.foregroundStyle(by: .value("Party", element.party))
				.interpolationMethod(.catmullRom)
			}
		}
    }
}
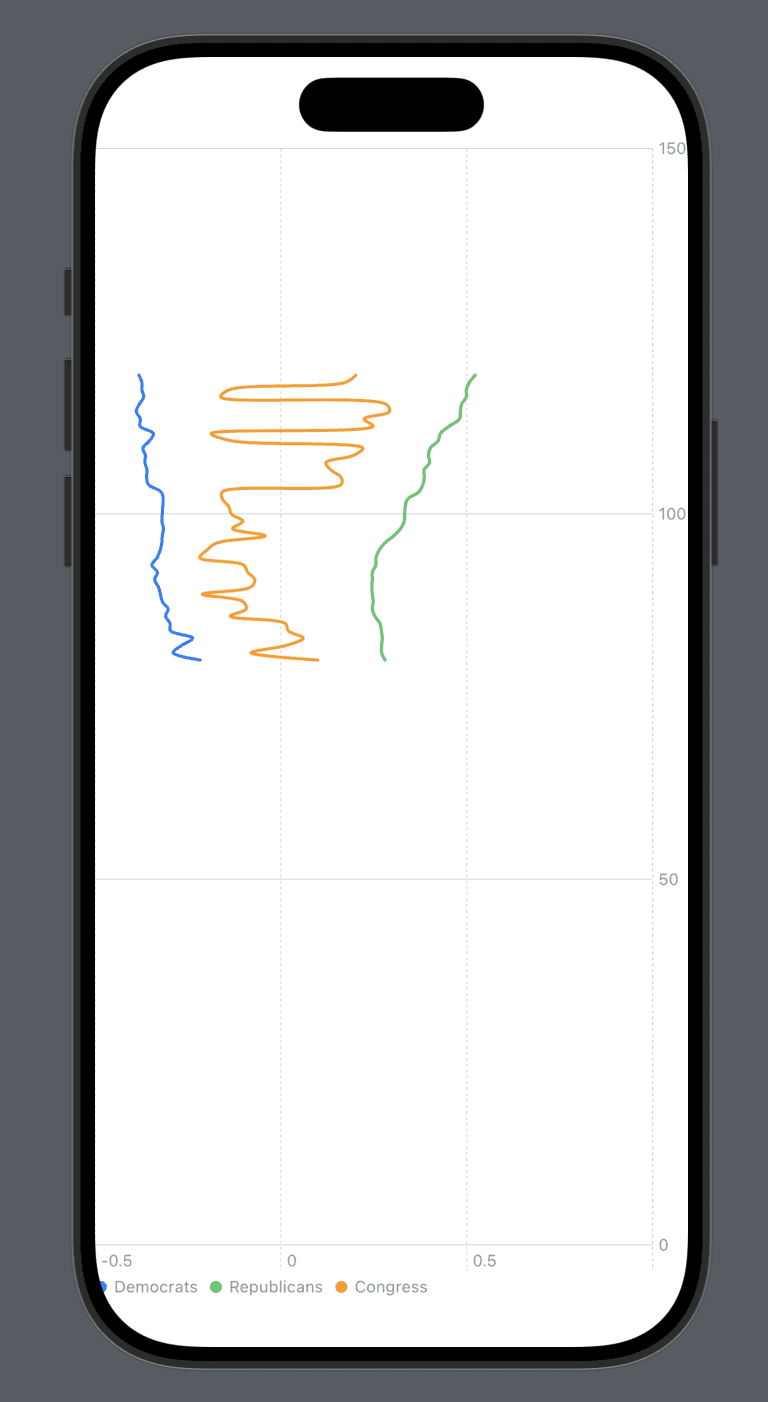
With that, you should end up with something resembling the beginning of a child's drawing—but it's a start:
To get this looking more like the chart we want, let's:
move the legend above the chart
give the lines party-appropriate colors (red for Republicans, blue for Democrats, and gray for Congress as a whole)
move the y-axis marks to the left side
add an x-axis label indicating that the left side (negative values) indicates liberalism and the right side (positive values) indicates conservatism
because we want this label to be right in the middle of the axis, we need to add an offset
adjust the range of the x and y axes and give the chart an aspect ratio of 1
So add these modifiers to the Chart:
.chartLegend(position: .top, spacing: 16)
.chartForegroundStyleScale(
	domain: ["Democrats", "Republicans", "Congress"],
	range: [.blue, .red, .gray]
)
.chartYAxis {
	AxisMarks(position: .leading, values: .automatic(desiredCount: 10))
}
.chartXAxisLabel(position: .bottom, alignment: .center) {
	HStack {
		Image(systemName: "arrow.left")
		Text("More Liberal")
		Spacer(minLength: 80)
		Text("More Conservative")
		Image(systemName: "arrow.right")
	}
	.fontWeight(.medium)
	.offset(x: 17)
}
.chartYScale(domain: range)
.chartXScale(domain: -0.6...0.6)
.aspectRatio(1, contentMode: .fit)
You'll notice that the chartYScale has a domain of range, a computed property I haven't defined yet, but I actually don't want the y axis to be integers referring to each Congress. Most people probably don't have a good sense of which Congress corresponds to which years, so it's not very intuitive and doesn't easily indicate the passage of time. It would be better to use years instead, so users could understand that they are looking at decades-long shifts.
To convert a particular meeting of Congress into a year that can be plotted on a chart, we're going to create the enum Congress to easily define properties commonly associated with Congresses where:
the raw value corresponds to the Congress as an integer
a convertToYear() function that returns a date
note that I've used January 1 for the month and day, but these are just placeholders (a new Congress usually isn't sworn in until later in the month/year, so this isn't meant to represent an exact date when that Congress was in session)
the year as an Int for the particular Congress (e.g., the 119th Congress corresponds to 2025, etc.)
enum Congress: Int, CaseIterable {
	case congress119 = 119
	case congress118 = 118
	case congress117 = 117
	case congress116 = 116
	case congress115 = 115
	case congress114 = 114
	case congress113 = 113
	case congress112 = 112
	case congress111 = 111
	case congress110 = 110
	case congress109 = 109
	case congress108 = 108
	case congress107 = 107
	case congress106 = 106
	case congress105 = 105
	case congress104 = 104
	case congress103 = 103
	case congress102 = 102
	case congress101 = 101
	case congress100 = 100
	case congress99 = 99
	case congress98 = 98
	case congress97 = 97
	case congress96 = 96
	case congress95 = 95
	case congress94 = 94
	case congress93 = 93
	case congress92 = 92
	case congress91 = 91
	case congress90 = 90
	case congress89 = 89
	case congress88 = 88
	case congress87 = 87
	case congress86 = 86
	case congress85 = 85
	case congress84 = 84
	case congress83 = 83
	case congress82 = 82
	case congress81 = 81
	case congress80 = 80

	func convertToYear() -> Date {
		var comps = DateComponents()
		comps.day = 1
		comps.month = 1
		comps.year = self.year

		let date = Calendar.current.date(from: comps)!
		return date
	}

	static func findCase(for congress: Int) -> Congress {
		Congress(rawValue: congress) ?? .congress119
	}

	var year: Int {
		self.rawValue * 2 + 1787
	}
}
With this enum in place, we can change the y property of our LineMark to this:
LineMark(
	x: .value("DW-NOMINATE Score", element.median),
	y: .value("Congress", Congress.findCase(for: element.congress).convertToYear()),
	series: .value("Party", element.party)
)
The range computed property, then, defines a range for the y axis of the chart from 1945-2030:
var range: ClosedRange<Date> {
	var components = DateComponents()
	components.day = 1
	components.month = 1
	components.year = 1945

	let beginning = Calendar.current.date(from: components)!

	var components2 = DateComponents()
	components2.day = 1
	components2.month = 1
	components2.year = 2030

	let end = Calendar.current.date(from: components2)!

	let range = beginning...end
	return range
}
Okay, we're almost done. For the charts in Informed, I like to try to add a little bit of interactivity, maybe a button or a slider or a way to select part of the chart and see more information. For this chart, we're going to add a toggle to show or hide the gray Congress line. So let's add a @State property to track whether the toggle is on or off and another computed property that will change the data in the chart when the toggle's state changes.
@State private var showCongressMedian: Bool = false

var filteredChartData: [ChartData] {
	return showCongressMedian ? chartData : chartData.filter { $0.party != "Congress" }
}
(Again, the "not equal to" operator in Swift (!=) renders above as ≠, but it will copy and paste correctly.)
And add this toggle below the chart:
Toggle(isOn: $showCongressMedian.animation()) {
	Text("Show Congress median")
		.fontWeight(.medium)
}
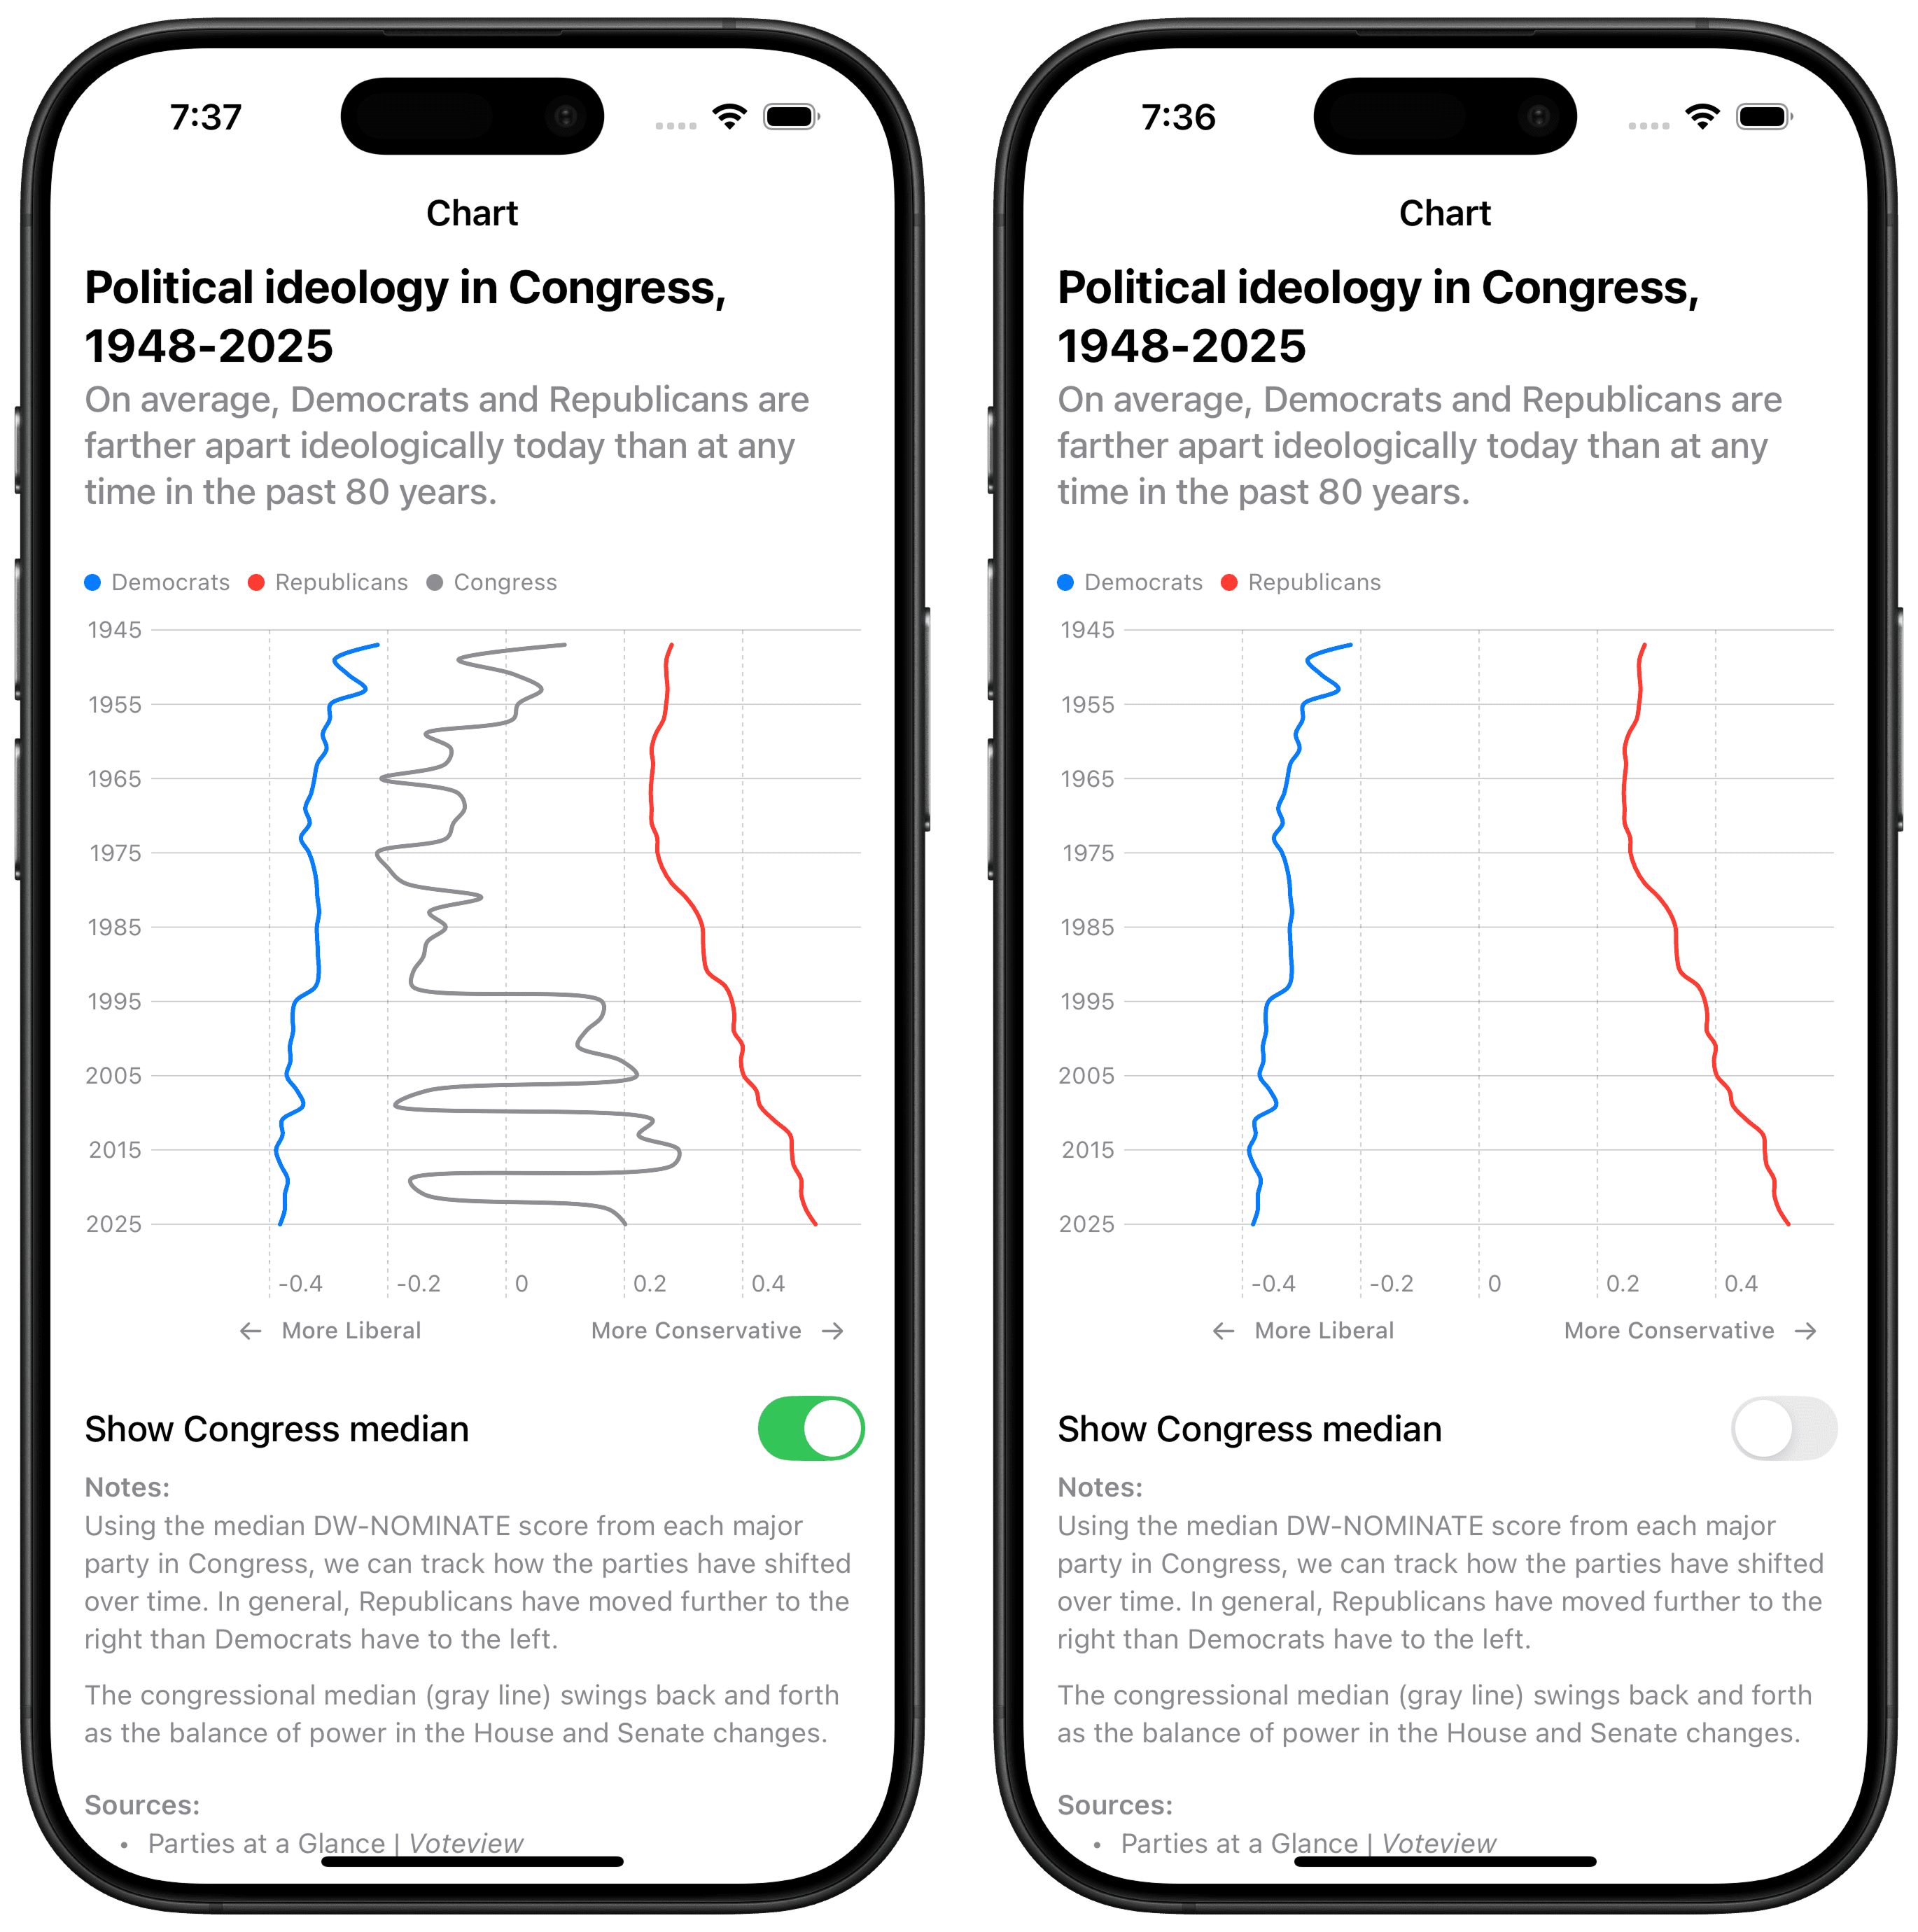
To really go the extra mile with this chart, we're going to finish by adding:
a title, which should be short and descriptive
a subtitle, which I format as the main conclusion or takeaway I want the user to have
a note or footnote, which is an explanation of the data and/or how to interpret the chart, or any other details or definitions that are important to know
a source of where I got the data from
Here's the full code for ChartView:
struct ChartView: View {
	let chartData: [ChartData]
	@State private var showCongressMedian: Bool = false

	var filteredChartData: [ChartData] {
		return showCongressMedian ? chartData : chartData.filter { $0.party != "Congress" }
	}

	var range: ClosedRange<Date> {
		var components = DateComponents()
		components.day = 1
		components.month = 1
		components.year = 1945

		let beginning = Calendar.current.date(from: components)!

		var components2 = DateComponents()
		components2.day = 1
		components2.month = 1
		components2.year = 2030

		let end = Calendar.current.date(from: components2)!

		let range = beginning...end
		return range
	}

	var body: some View {
		ScrollView {
			VStack(alignment: .leading) {
				ChartTitle(headline: "Political ideology in Congress, 1948-2025", subheadline: "On average, Democrats and Republicans are farther apart ideologically today than at any time in the past 80 years.")

				Chart {
					ForEach(filteredChartData, id: \.self) { element in
						LineMark(
							x: .value("DW-NOMINATE Score", element.median),
							y: .value("Congress", Congress.findCase(for: element.congress).convertToYear()),
							series: .value("Party", element.party)
						)
						.foregroundStyle(by: .value("Party", element.party))
						.interpolationMethod(.catmullRom)
					}
				}
				.chartLegend(position: .top, spacing: 16)
				.chartForegroundStyleScale(
					domain: showCongressMedian ? ["Democrats", "Republicans", "Congress"] : ["Democrats", "Republicans"],
					range: showCongressMedian ? [.blue, .red, .gray] : [.blue, .red]
				)
				.chartYAxis {
					AxisMarks(position: .leading, values: .automatic(desiredCount: 10))
				}
				.chartXAxisLabel(position: .bottom, alignment: .center) {
					HStack {
						Image(systemName: "arrow.left")
						Text("More Liberal")
						Spacer(minLength: 80)
						Text("More Conservative")
						Image(systemName: "arrow.right")
					}
					.fontWeight(.medium)
					.offset(x: 17)
				}
				.chartYScale(domain: range)
				.chartXScale(domain: -0.6...0.6)
				.aspectRatio(1, contentMode: .fit)
				.padding(.vertical)

				Toggle(isOn: $showCongressMedian.animation()) {
					Text("Show Congress median")
						.fontWeight(.medium)
				}

				ChartFootnote {
					Text("Using the median DW-NOMINATE score from each major party in Congress, we can track how the parties have shifted over time. In general, Republicans have moved further to the right than Democrats have to the left.")
						.padding(.bottom, 6)
					Text("The congressional median (gray line) swings back and forth as the balance of power in the House and Senate changes.")
				}
				.padding(.bottom, 8)

				ChartSources(sources: [CustomURL(pageTitle: "Parties at a Glance", siteTitle: "Voteview", url: "https://voteview.com/parties/all")])
			}
		}
		.contentMargins(.horizontal, 16, for: .scrollContent)
		.navigationTitle("Chart")
		.navigationBarTitleDisplayMode(.inline)
	}
}
ChartTitle, ChartFootnote, and ChartSources are child views designed to help give all my charts a clear, consistent style:
struct ChartTitle: View {
	let headline: String
	let subheadline: String

	var body: some View {
		VStack(alignment: .leading) {
			Text(headline)
				.font(.title2).bold()
			Text(subheadline)
				.foregroundStyle(.secondary)
				.fontWeight(.medium)
		}
	}
}

struct ChartFootnote<Content: View>: View {
	let content: Content

	init(@ViewBuilder content: () -> Content) {
		self.content = content()
	}

	var body: some View {
		VStack(alignment: .leading) {
			Text("Notes:")
				.fontWeight(.semibold)
			content
		}
		.font(.footnote)
		.foregroundStyle(.secondary)
		.frame(maxWidth: .infinity, alignment: .leading)
		.padding(.bottom, 6)
	}
}

struct ChartSources: View {
	let sources: [CustomURL]
	let bullet: String =  "•"

	var body: some View {
		VStack(alignment: .leading) {
			Text("Sources:")
				.fontWeight(.semibold)
			ForEach(sources, id: \.self) { source in
				Link(destination: URL(string: source.url)!) {
					if source.pageTitle.isEmpty || source.siteTitle.isEmpty {
						HStack(alignment: .top) {
							Text(bullet).bold()
							Text(source.pageTitle)
							+ Text(source.siteTitle)
								.italic()
						}
					} else {
						HStack(alignment: .top) {
							Text(bullet).bold()
							Text(source.pageTitle)
							+ Text(" | ")
							+ Text(source.siteTitle)
								.italic()
						}
					}
				}
				.padding(.horizontal)
				.buttonStyle(.plain)
			}
		}
		.font(.footnote)
		.foregroundStyle(.secondary)
		.padding(.bottom, 6)
	}
}

struct CustomURL: Hashable, Identifiable {
	let pageTitle: String
	let siteTitle: String
	let url: String
	let id = UUID()
}
Here's the final chart:
The full project code is available on GitHub.
